| ward |
project name |
limits |
scope |
estimated costs |
Status |
Estimated construction start date |
Estimated construction end date |
| city wide |
2007 Concrete Requirement Contract |
Citywide |
Requirement Contract to
replace curb ramps on newly
resurfaced streets; other
concrete work as required.
|
$1,700,000 |
Design |
Apr-07 |
Jun-08 |
| 12 |
Aetna Rd. Bridge
Replacement
|
E. 80th to E. 91st
|
Bridge replacement |
$2,000,000
|
Design |
Mar-10 |
Aug-11 |
| 13 |
Avenue District, Ph 2
|
E. 12th St., Lakeside to Chester
|
Reconfigure Street, add
streetscape amenities
|
$5,000,000 |
Design |
Aug-07 |
Aug-08 |
| 19 |
Bellaire Rd. Rehab Ph 1
|
W. 105th to W. 117th
|
New Curb, Sidewalks and
asphalt Street
|
$4,200,000 |
Design |
Feb-08 |
Oct-09 |
| 19 |
Bellaire Rd. Rehab Ph 2
|
W. 117th to W. 130th
|
Road resurfacing, traffic signal
upgrades, curb ramp upgrades
and miscellaneous curb
andsidewalk repairs.
|
$3.115.000 |
Planning |
Oct-08 |
Jun-10 |
| 5,2 |
Bessemer Ave. Ph 2 - Final
Engineering and ROW
Acquisition
|
Bessemer Ave. to Aetna along
E. 88th Street
|
New Roadway to get industrial
traffic from E. 93rd to I-490
efficiently.
|
$1,150,000 |
Design |
Mar-09 |
Dec-10 |
http://www.city.cleveland.oh.us/pdf/PS/2007%20Project%20Update%20for%20Website.pdf
Geographic Location
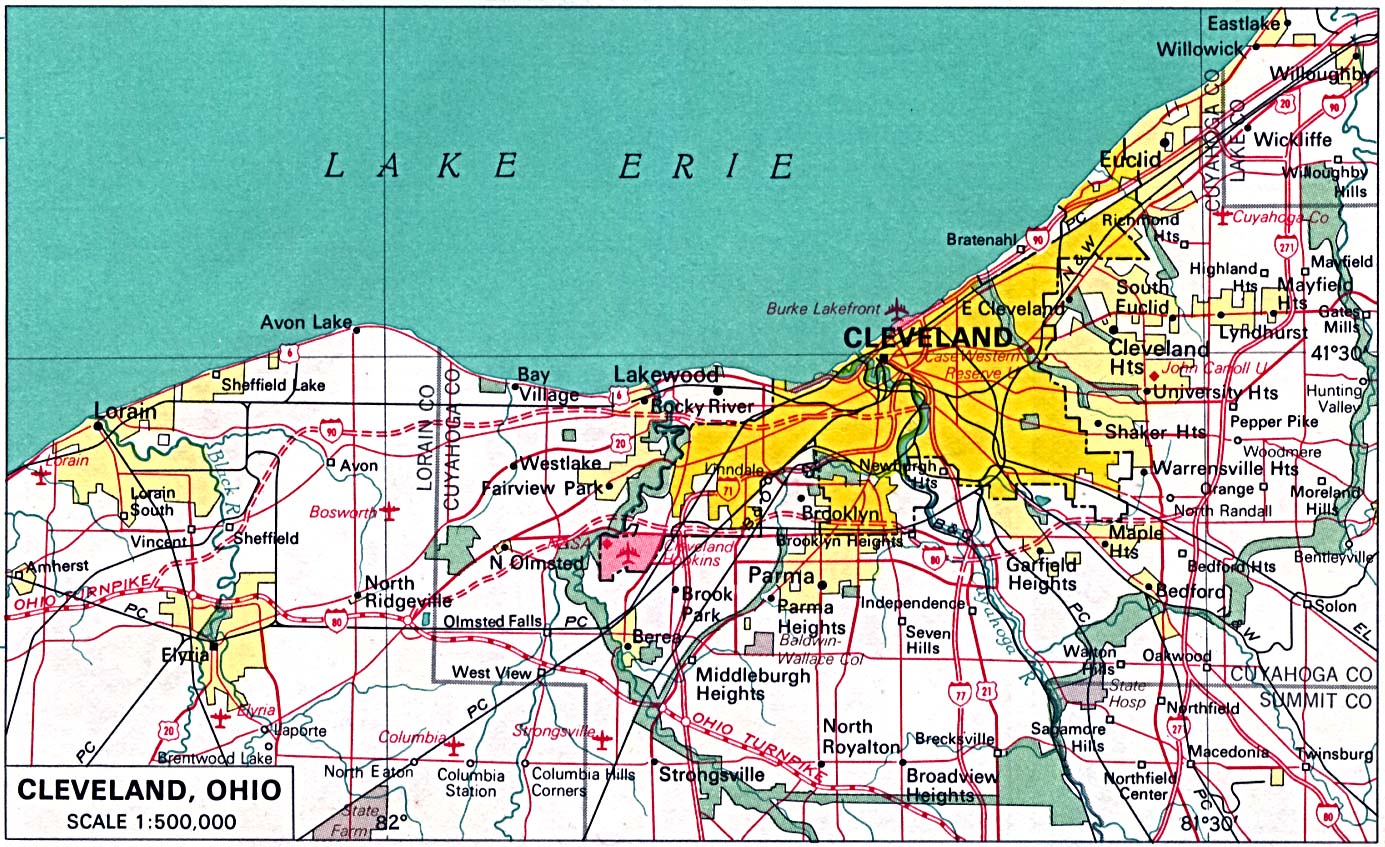
Cleveland, which is located on the northeastern part of the state of Ohio, lies along the south shore of Lake Erie. It extends 31 miles along the shore and is therefore primarily located on the Lake Plain on the west side of Cleveland. The Lake Plain, which is most of the western part of Cleveland, is also accompanied with a few terraces which tend to be about 600 ft above sea level. The eastern side of the urban Cleveland area tends to rest upon the Appalachian Plateau, which generally has an elevation of about 1,100 ft. A convenient aspect about the city of Cleveland is that it has a river called the Cuyahoga River that runs North and South and helps to divide the western and eastern sections of Cleveland. Although it does have the Appalachian Mountains to the east of it, it lies on a relatively level plain. [G1 [G2]
Area: 82.42 square miles
[G3] 

[G4]
Economy
Early after its founding Cleveland became a leading industrial center for the Midwest. Production of iron and its products were the first main industry to dominate Cleveland’s early economy. Soon mass-produced standardized products also became crucial to the economy. Cleveland’s excellent transportation system helped to facilitate its growing industrial based economy. (E1) Some of the goods produced in this region include iron and steel, automobile parts, machine tools, paints and lacquers, rubber and oil products, chemicals, rayon, electrical machinery and appliances, and men's and women's clothing. (E2) In recent years due to national economic changes jobs available for the Cleveland’s manufacturing workers have been drastically reduced. As a result there is a 31% poverty rate and a large sector of undereducated workers. The city has sought to diversify its economy by attracting large corporate companies into the region. (E3) Now the city is headquarters to eleven Fortune 500 companies. It also serves as home to over 150 international companies. Important to the growth of the manufacturing industry is Cleveland’s strong base for science and engineering firms. (E2) In early 2000 the "One Community Project" began to help facilitate technologic advances and growth for the area. It has since attracted the attention of Intel who awarded the city “Intelligent Community of the Year" in 2005. (E5) Another important sector of Cleveland’s economy is its healthcare industry. Cleveland’s Clinic Foundation hospital is the largest employer for the city and ranks on U.S. News & World Report’s list of best hospitals in the nation. (E4) Finally, Cleveland’s economy is expanding due to its growing research in the healthcare fields. Over one hundred biotechnology firms and over one hundred research labs exist in the area. (E2) The city is continuing to address issues of sustainability which entail improving its economic base. Much of Cleveland’s economy is being refocused to service-base instead of manufacture-based. (E3)
 [E6]
[E6]
Land Use
The City of Cleveland is a well developed metropolitan area with many buildings and skyscrapers, including The Key Tower [L1], Terminal Tower [L2], and the BP Building [L3]. Cleveland also houses many professional sports teams including, Indians, Browns, and Cavaliers. [L4] Cleveland is located on Lake Erie, and the Cuyahoga River goes directly through the center of the city. Cleveland has four major parks including, Lakefront State Park and Cuyahoga Valley National Park. [L4] At one time Cleveland was a heavily forested area[L5, but with time the city transformed into an industrial and manufacturing city. Throughout the years, with the decline of manufacturing it has become more urbanized, which has led to several environmental problems such as the reduction of farmland, wetlands, wildlife and plant habitat. [L5] These environmental problems have caused other problems including, greenhouse effects, flooding problems, and poor air and water quality. [L5 With the expansion of urbanization, most of the key agricultural land is continuously being threatened. [L5]


Cuyahoga Valley National Park [L6] Jacobs Field, Downtown Cleveland [L7]
Climate
Cleveland has a typical climate of the midwestern United States. Summers are hot and humid, while winters are cold and snowy. Cleveland is on the shoreline of Lake Erie and is greatly affected by lake effect snow. Below are the average temperatures is Cleveland, as well as the temperatures Cleveland experienced in the past year
| Month |
Low |
High |
| Jan |
18.8°F |
32.6°F |
| Feb |
21.0°F |
35.8°F |
| Mar |
28.9°F |
46.1°F |
| Apr |
37.9°F |
57.3°F |
| May |
48.3°F |
68.6°F |
| Jun |
57.7°F |
77.4°F |
| Jul |
62.3°F |
81.4°F |
| Aug |
61.2°F |
79.2°F |
| Sept |
54.3°F |
72.3°F |
| Oct |
43.7°F |
60.8°F |
| Nov |
34.9°F |
48.7°F |
| Dec |
24.9°F |
37.4°F |
|
 |
Average Temperature (°F)
|
Observed High and Low Temperatures and Precipitation for 2007
|
| http://www.rssweather.com/climate/Ohio/Cleveland/ |
http://www.erh.noaa.gov/cle/climate/graphs/CLE_graph.html |
[C1]
 [C5]
[C5]
Average Percipitation
|
Month
|
Jan.
|
Feb.
|
Mar.
|
Apr.
|
May
|
Jun.
|
Jul.
|
Aug.
|
Sep.
|
Oct.
|
Nov.
|
Dec.
|
|
Inches
|
2.6
|
2.3
|
3.0
|
3.4
|
3.5
|
3.5
|
3.6
|
3.4
|
3.2
|
2.6
|
3.2
|
2.9
|
[C6]
The average precipitation each year is 37.2 inches.

Cleveland has an average annual snowfall of 56.3 in .
Cleveland is the windiest city in Ohio. The winds average 11 mph. [C7]
Degree Days
Cleveland has an average of 3242 growing degree days. [C2]
| Element |
JAN |
FEB |
MAR |
APR |
MAY |
JUN |
JUL |
AUG |
SEP |
OCT |
NOV |
DEC |
ANN |
GDD
Base 40 |
20 |
29 |
114 |
274 |
590 |
843 |
1010 |
962 |
725 |
411 |
155 |
40 |
5177 |
GDD
Base 45 |
7 |
11 |
65 |
169 |
437 |
693 |
855 |
807 |
575 |
271 |
85 |
18 |
4000 |
GDD
Base 50 |
2 |
3 |
33 |
96 |
296 |
544 |
700 |
652 |
427 |
157 |
41 |
8 |
2964 |
GDD
Base 55 |
0 |
1 |
15 |
50 |
180 |
396 |
545 |
497 |
287 |
79 |
15 |
2 |
2072 |
GDD
Base 60 |
0 |
0 |
6 |
21 |
97 |
260 |
390 |
343 |
168 |
31 |
4 |
0 |
1324 |
MGDD*
Base 50 |
10 |
16 |
72 |
159 |
346 |
545 |
683 |
645 |
447 |
219 |
76 |
20 |
3242 |
|
| http://mrcc.sws.uiuc.edu/climate_midwest/historical/grow/oh/331657_gsum.html |
Records
Record High Temperatures
|
Month
|
Record High
|
Record Low
|
|
January
|
73°F (1950)
|
-20°F (1994)
|
|
February
|
74°F (2000)
|
-16°F (1899)
|
|
March
|
83°F (1945)
|
-5°F (1984)
|
|
April
|
88°F (1986)
|
10°F (1964)
|
|
May
|
92°F (1959)
|
25°F (1966)
|
|
June
|
104°F (1988)
|
31°F (1972)
|
|
July
|
103°F (1941)
|
41°F (1968)
|
|
August
|
102°F (1948)
|
38°F (1982)
|
|
September
|
101°F (1953)
|
32°F (1942)
|
|
October
|
90°F (1946)
|
19°F (1988)
|
|
November
|
82°F (1950)
|
3°F (1976)
|
|
December
|
77°F (1982)
|
-15°F (1989)
|
The highest recorded temperature was 104°F in 1988, while the lowest recorded temperature was -20°F in 1994. [C3]
The record precipitation is 4.59 inches in September 1996 and the record snowfall is 13.6 inches in February 1993. [C4]
Ecology
The Cuyohoga River—running through Cleveland—provides a home to many different species. The river itself has a diverse fish population, amphibians, invertebrates, and mollusks. Some of the fish include goldfish, northern largemouth black bass, bluegill, northern pike, channel catfish, and many species of minnow. Pollution in the river has caused many of the amphibians, such as salamanders, newts, and frogs, to decline in population. Non-aquatic animals also find there home near the Cuyohoga River. Beavers, mink latrines, deer, foxes, coyote, blue heron, ducks, geese, hawks, songbirds, and many others claim home to the area. Some species such as bear, elk, and wolf have been forced out of the area and are unlikely to return. Due to flooding, the surrounding floodplains are rich in minerals which support a wide variety of plant life. Some of the plants include trillium, bloodroot, dogtooth violet, phlox, wild geranium, Virginia bluebells and toothworts. The Endangered Species Act has helped to protect many of the plant species residing near the Cuyohoga River. [Ec1]
|

Quillback Carpsucker
http://www.tnfish.org/
|

Virginia Bluebells
http://icons-pe.wunderground.com/data/wximagenew/a/AlteredStars/31.jpg
|
Topography
The city of Cleveland is comprised of 77.6 square miles of land and 4.8 square miles of water, for a combined total of 82.4 square miles. It is located at latitude 41°28′56″N and longitude 81°40′11″W, near the mouth of the Cuyahoga River and Lake Erie. [TO3] The city is built on a delta plain which was created during the time period of glaciers in southern Canada and what is now the Great Lakes region approximately 20,000 years ago. [TO4][TO5] Along Lake Erie is a series of bluffs. A bluff is a very steep and high cliff or hill that is usually located along the banks of a body of water, as it is in Cleveland. [TO6] The bluffs are cut in certain places by the Big Creek, Euclid Creek, and the Cuyahoga River. Because of these bluffs, the elevation of the land quickly increases, with the shore of Lake Erie sitting at 569 feet above sea level and at 5 miles inward sitting at 791 feet. [TO7]
The map below depicts the elevations of the landforms surrounding the Cuyahoga River which flows through Cuyahoga County.[TO1]] Cleveland lies on the irregular bluffs, which are parallel to the lake, and cut by the Cuyahoga River, Big Creek, and Euclid Creek. From here, the land rises. Hopkins Airport, discussed above, is only 5 miles from the shore, yet it is elevated 791 feet.[TO2] The second map, found on the United States Census website, further breaks down the composition of the city.
Sources
[P1] http://www.census.gov/population/cen2000/phc-t5/tab02.txt
[P2] http://factfinder.census.gov/servlet/GCTTable?_bm=y&-ds_name=DEC_2000_SF1_U&-CONTEXT=gct&-mt_name=DEC_2000_SF1_U_GCTPH1_US25&-redoLog=false&-_caller=geoselect&-geo_id=&-format=US-10%7CUS-10S&-_lang=en
[P3] http://factfinder.census.gov/
[P4] http://cleveland.about.com/b/2007/08/28/cleveland-returns-to-the-top-of-the-poverty-list.htm
[P5] http://factfinder.census.gov/servlet/ACSSAFFFacts?_event=Search&geo_id=&_geoContext=&_street=&_county=cleveland&_cityTown=cleveland&_state=04000US39&_zip=&_lang=en&_sse=on&pctxt=fph&pgsl=010
[T1] http://www.clevelandairport.com/site/395/default.aspx
[T2] http://www.clevelandairport.com/site/470/default.aspx
[T3] http://www.gcrta.org/ro.asp
[G1] http://www.city-data.com/us-cities/The-Midwest/Cleveland-Geography-and-Climate.html
[G2] http://www.usacitiesonline.com/ohcountycleveland.htm#location
[G3] http://ohio.wedding.net/images/180px-Geographic_regions_ohio.svg.png
[G4] http://www.lib.utexas.edu/maps/world_cities/cleveland.jpg
[E1] http://ech.case.edu/ech-cgi/article.pl?id=I4
[E2] http://www.city-data.com/us-cities/The-Midwest/Cleveland-Economy.html
[E3] http://planning.city.cleveland.oh.us/cwp/sus_trend.php
[E4] http://www.acinet.org/acinet/oview6.asp?soccode=&stfips=39&from=State&id=&nodeid 12
[E5] http://www.onecommunity.org/
[E6] http://www.census.gov/econ/census02/data/ar/AR025.HTM
[L1] http://www.emporis.com/en/wm/bu/?id=keytower-cleveland-oh-usa
[L2] http://www.emporis.com/en/wm/bu/?id=terminaltower-cleveland-oh-usa
[L3] http://skyscraperpage.com/cities/?buildingID=2921
[L4] http://www.city.cleveland.oh.us/information/
[L5] http://planning.city.cleveland.oh.us/cwp/sus_trend.php
[C1] http://mrcc.sws.uiuc.edu/climate_midwest/historical/temp/oh/331657_tsum.html
[C2] http://mrcc.sws.uiuc.edu/climate_midwest/historical/grow/oh/331657_gsum.html
[C3] http://www.weather.com/weather/wxclimatology/monthly/USOH0195
[C4] http://www.erh.noaa.gov/cle/climate/cle/records/cletop10temp.html
[C5] http://www.city-data.com/city/Cleveland-Ohio.html
[C6] http://www.weatherbase.com/weather/weather.php3?s=042527&refer=
[C7] http://www.city-data.com/states/Ohio-Climate.html
[Ec1] http://www.bbc.co.uk/dna/getwriting/A2894718
[TO1] http://www.cuyahogavalley.net/topo_map.html
[TO2] http://en.wikipedia.org/wiki/Cleveland,_Ohio#_note-24
[TO3] http://www.census.gov/geo/www/gazetteer/gazette.html
[TO4] http://www.glerl.noaa.gov/pr/ourlakes/background.html
[TO5] https://kb.osu.edu/dspace/bitstream/1811/4012/1/V53N02_053.pdf
[TO6] http://www.merriam-webster.com/dictionary
[TO7] http://www.airnav.com/airport/KCLE
Weather of Cleveland, Ohio

http://collegeandproball.blogspot.com/2007_04_08_archive.html
Lake Effect Snow (Jeremy Werner)
Cleveland is positioned along the southwest end of the American snowbelt that starts in northeastern Ohio and runs along the shores of Lake Erie and Lake Ontario to northern New York state. The area is referred to as a “snowbelt” because of the substantial amounts of snow it receives each year, much of which comes from lake-effect snow.
Cleveland averages 56.9 inches of snow a year, making it the second snowiest U.S. city with a population higher than 400,000. [LE1] Denver is the snowiest major city with an average annual snowfall of 60.3 inches. [LE2]
Cleveland’s position along Lake Erie is decisive in its heavy doses of lake-effect snow. To create the most fetch for optimal snowfall, winds need to be out of the west or northwest. Winds that take longer paths over the frictionless lake evaporate more water increasing the amount of snowfall. Since Cleveland lies downwind on the southeastern shores of Lake Erie, the city receives a great amount of Lake Effect snow. The skyscrapers of the city also enhance the amount of lake-effect snow because the barriers force air to rise promoting cloud formation and precipitation.
Cleveland, like most other areas, can receive lake-effect snowfalls from October to March when the temperature of the lake is warmer than surface air temperature. However, Lake Erie is the shallowest of all the Great Lakes with an average depth of 62 feet. [LE3] Because it is relatively shallow, the lake usually freezes in mid-January, preventing the wind from evaporating any moisture from the lake. The freezing essentially ceases lake-effect snow until the lake thaws in late winter or early spring.
Because of the frequency of lake-effect snow, the city of Cleveland issues three levels of snow warnings for commuters. Category 1 warnings advise drivers to use caution on the roads, Category 2 warnings advise commuters to only drive if necessary, and Category 3 warnings essentially shut down roads, allowing only emergency vehicles to use the roads. [LE4]
Case Study- Lake Effect Snow (Jeremy Werner)
Sometimes, the city can receive severe levels of snowfall in just a couple of days from lake-effect snow. On November 9, 1996, cold winds from Canada blew southward then turned southeast over Lake Erie, cloaking Cleveland in white. After five days, the Veteran’s Day storm of 1996 dumped almost 70 inches on parts of the Cleveland area. [LE5]
The heavy snow knocked out the electricity of almost 200,000 homes. [LE6] Most of Cleveland received around 20 inches of snow. Flights were grounded with Hopkins Airport under 18 inches of snow.
The hardest hit areas, however, were just east of the city. Shaker Heights, Ohio, just 9 miles to the northeast of Cleveland, had snowfalls of about 50 inches. Chardon, Ohio, about 40 miles northeast of Cleveland, received the most snow at about 69 inches. [LE6] However, the city of Akron, which lies about 40 miles south of Cleveland received only two inches, displaying how localized lake-effect snow storms are. The system died before it reached Akron because the winds had traveled over too much land and were unable to pick up any more moisture to keep going.

http://ww2010.atmos.uiuc.edu/(Gh)/arch/cases/961109/data/snw/snw.rxml
Case Study - The Great Blizzard of 1978 (Maureen Hellstrom, mhellst2)
 |
| http://www.ohiohistory.org/etcetera/exhibits/swio/pages/albums/1978_blizzard/1978_blizzard_albumPage02.html |
One of the worst storms to ever hit Cleveland Ohio occurred on Thursday, January 26, 1978. It continued through until the next day. Ohio experienced winds of 50 to 70 mph. Enormous snow drifts resulted, which covered car and homes, in addition to blocking highways, railroads, and the airport. All airports, in addition to businesses and schools, were closed for 2 days following the storm. However, it took the state even longer to return back to its normal pace. Therefore, the economy of the state was obviously affected by the storm. [GB1]
Over 5000 members of the Ohio National Guard were called into action. These people worked to clear the roads, assist utility crews, rescue stranded pedestrians, and transport doctors and nurses to hospitals. Forty five National Guard helicopters flew through the state to rescue thousands of stranded individuals, some of them in need of immediate medical attention. In addition to the National Guard, thousands of volunteers helped to transport both doctors/nurses and medicines to hospitals. Despite these efforts, 51 people still died from this storm, which makes this one of the deadliest storms in Ohio’s history. [GB1]
This storm was not merely a blizzard; rather it was a severe blizzard. A severe blizzard is characterized as winds at least 45 mph, a great density of either falling or blowing snow, and temperatures of 10 degrees or less. In this storm, there were winds of over 100 mph in some areas of the state, and sustained winds of 45-60 mph. There were record snowfalls in many areas as well. [GB2] The central pressure was recorded at 28.28 inches as the storm went through Ohio. There was 82 mph winds in Cleveland, and the temperate dropped from around 44 degrees as 4AM to 7 degrees by 10AM.[GB3]
This storm was actually the result of two unrelated low pressure systems areas, the first one being in the western Gulf of Mexico
and the second one in northern North Dakota. The low in North Dakota was expected to pass north of Ohio, which would have had no significant weather impact on the state. The low from the Gulf of Mexico was expected to more northeastern toward Ohio. This would have caused rain to develop, which would eventually turn into snow as colder air moved behind the storm system. However, the low from North Dakota began to more to the southeast, and the atmospheric pressure north of the Gulf low began to fall drastically. Forecasters were said to have done a pretty good job at predicting this storm, especially considering the fact that forecasters did not have the tools available to meteorologists today. At 4:30 PM on Wednesday, January 25th, the Weather Service issued heavy snow warnings for northeastern Ohio as well as a winter storm warning for the rest of the state. By the evening, the low from North Dakota was heading straight for Ohio, which indicated that that very severe weather was going to occur. Blizzard warnings were issued for the entire state at 9PM on January 25th. The weather conditions at the time this warning was issued was not indicative of the horrible storm that lay ahead, which is one reason why this storm came as such a surprise to those living in Ohio. When the two low pressures systems collided, they twisted together, which is extremely rare.
Heat Waves (Maureen Hellstrom, mhellst2)
A heat wave can be defined as temperatures that are unusually high for a particular region during a warm season. There are four factors that increase the severity of a heat wave. Although all four factors are not necessarily present at the same time, each additional factor will increase the severity of a heat wave. The first factor is the absence of polar airmasses that may move into the region from the north or the west. The second factor is strong heating of the surface, which typically occurs on a cloud free day. The third factor is a dry ground, which allows for a feedback between the drought and extreme heat, and the final factor is the amount of vertical mixing in the air. Heat waves tend to be worse in cities or downtown regions, such as Cleveland, due to the urban heating effect. The urban heating effect essentially means that urban areas tend to be hotter then the surrounding rural areas. One reason is because asphalt and concrete present in urban areas retain more heat. This consequently prevents the city from significantly cooling down at night. Furthermore, the number of heat sources, such as cars and air conditioners, result in higher overall temperatures. Another reason is that tall buildings enhance the likelihood that heat will be absorbed. The final reason is that cooling due to latent heat consumption during evaporation occurs in areas with heavy vegetation, which major cities lack. Below are the average temperatures in Cleveland. If a heat wave were to occur, the city would have to experience temperatures higher then this average for a prolonged period of time. [HW3]
 |
| Month |
Low |
High |
| Jan |
18.8°F |
32.6°F |
| Feb |
21.0°F |
35.8°F |
| Mar |
28.9°F |
46.1°F |
| Apr |
37.9°F |
57.3°F |
| May |
48.3°F |
68.6°F |
| Jun |
57.7°F |
77.4°F |
| Jul |
62.3°F |
81.4°F |
| Aug |
61.2°F |
79.2°F |
| Sept |
54.3°F |
72.3°F |
| Oct |
43.7°F |
60.8°F |
| Nov |
34.9°F |
48.7°F |
| Dec |
24.9°F |
37.4°F |
|
| http://www.rssweather.com/climate/Ohio/Cleveland/ |
|
Global warming can have a significant impact on the number of heat waves that will occur in the region. One projection, made by the Intergovernmental Panel on Climate Change, estimated that by 2100 temperatures in Ohio could increase by 3 degrees in summer, spring and winter, and 4 degrees in the fall. Additionally, the frequency of extremely hot days are predicted to increase, just like the overall temperatures. Currently, heat waves are an irregular occurrence in Ohio. However, one study predicted that an increase in Cleveland temperature of 4 degrees could result in an increase of heat related deaths, from 30 to 60. [HW1]
One notable heat wave occurred in Cleveland in 1934. In this year, the average summer temperature was 5 degrees warmer then the average at 75.7. July of 1934 was Ohio’s hottest month on record. It has been estimated that 130 people died within one week, from July 20th to July 26th. The number of deaths can be attributed to the fact that many homes at the time did not have air conditioning, unlike now. [HW2]
Floods (Anamae Freehauf afreeha2)
Floods are defined as “relatively high water that overflows the natural or artificial banks of a stream or coastal area that submerges land not normally below water level.” Damaging floods can occur anywhere across the United States. It is the nation’s number one natural disaster killing hundreds each year and causing billions in damage. There are three types of floods: widespread floods, flash floods, and coastal floods. [F1] Cleveland, Ohio is in a prime flood risk area and has a long history of flooding. Situated near Lake Eire with three bodies of water—Cuyahoga River, Big Creek, and Euclid Creek—running through it, Cleveland residents can expect flooding to be a potential risk. [F2]
 |
|
www.cleveland.com
|
Of the different types of flooding, flash flooding is the most pertinent risk. The key elements contributing to flash floods are rainfall intensity and duration. Other key elements include topography, soil conditions, and ground cover. If the ground is already saturated from previous rainfall flash floods are more likely to occur. Most flashfloods are caused by intense thunderstorms, training thunderstorms, or rains from hurricanes and tropical storms. Obviously, Cleveland is not normally affected by hurricane and tropical storm rains. Most heavy precipitation in the area is caused by thunderstorms. On average Cleveland receives around 37 inches of rain annually. [F3] During the spring and summer seasons storms can cause flash flooding quickly and often without warning. These thunderstorms can be air mass thunderstorms, mesoscale convective system thunderstorms, squall lines, or supercell thunderstorms. All types occur in this region of the country, though most frequently it is squall lines or supercell thunderstorms which are slow moving and dump the required amount of precipitation to result in flash floods. These storms often occur in the spring and summer months they also occur during the fall and even winter months. [F2] The thunderstorms are a result of an unstable environment with surface moisture air, a lifting mechanism, and wind shear. [F8]
 |
|
http://www.swenvo.org.uk/environment/images/flash_flooding_image.gif
|
Other causes of floods include dam and levee breakage. A levee is any artificial barrier that acts to divert or restrain the flow of a stream or body of water to protect an area from flooding. A dam is also an artificial barrier that acts to impound water. Although there has not been any recent failure in dams or levee in the Cleveland area officials are constantly inspecting them to ensure safety. [F9]
According to the National Climatic Data Center 73 flood events were reported in Cuyahoga County, Ohio between January 1, 1950 and December 31, 2007. Though there were no reports of death or injuries from the flooding there was an estimate of over 104. 134 million dollars in property damage as well as 15 thousand dollars in crop damage. In 2007 there were 6 flood events reported in Cuyahoga County resulting in 10.4 million dollars in estimated property damage. [F7]
 |
|
http://ecivwww.cwru.edu/civil/graphics/research/shaker1.gif
|
Important to the frequency of floods, is the area’s watershed. A watershed is the area of land where all of the water that is under it or drains off of it goes into the same place. The Shaker Lakes and Doan Brooks watershed of Cleveland is about 12 square miles. Recent development of the watershed area has caused increased rainfall that does not permeate the soil. This increased amount of rainfall running over the land in turn causes more flooding. Researchers are looking to completely redesign the Doan Brook channel in order to resolve issues related to urbanization of the drainage basin. This urbanization has resulted in increasing flood magnitudes as well as flood frequency. [F4]
The Ohio Department of Natural Resources, Division of Water has implemented The Floodplain Management Program to provide information on how to reduce the impact of flooding. They work with local governments to ensure safety measures, such as encouraging participation in the National Flood Insurance Program, are taken. The Floodplain Management Program aims to provide leadership toward cooperative management of Ohio’s floodplains to ensure the reduction of flood damage and to recognize the many benefits of natural flooding. [F9]
Case Study: Flash Floods (Anamae Freehauf afreeha2)
 |
 |
|
June 22, 2006
http://www.hpc.ncep.noaa.gov/dailywxmap/index_20080101.html
|
June 23, 2006
http://www.hpc.ncep.noaa.gov/dailywxmap/index_20080101.html
|
In the summer of 2006 heavy rains caused the worst flooding in nearly 50 years to many areas in Northeastern Ohio. Record flooding occurred across six counties which were declared Federal disaster areas. [F10] The Cuyahoga River flooded streets just south of Cleveland as well as areas in Lake County and Cuyahoga County. Cleveland, located within Cuyahoga County, was severely hit as well. Many residents were forced to evacuate from the rapidly rising flood waters. [F5]
Starting on June 22nd, heavy rains from severe thunderstorms in the area caused extensive flooding in both Lake and Cuyahoga Counties. Initially, only the eastern portion of the Cuyahoga County was warned by the National Climatic Data Center (NCDC). Later on in the evening the NCDC issued countywide flash flood and flood warnings. The ground was already saturated from heavy rains in the previous 24 hours. This caused immediate runoff and flash floods to develop quickly. [F6]
The meteorology associated with the flood was two consecutive days of severe thunderstorms. Events leading up to the flooding included above normal precipitation during May and early June. On June 21 a warm front lifted normal across northern Ohio drawing up tropical moisture. In the late afternoon hours thunderstorms developed into a mesoscale convective system that remained practically stationary over northern into the early morning of June 22. In the afternoon a cold front moved through the area triggering a second round of storms. It brought excess rainfall of 4 to 5 inches in hours. Another set of stationary thunderstorms developed along a lake breeze boundary causing 5 inches of rainfall over Cuyahoga County in less than 2 hours. The resulting influx of rainfall caused rising waters in streams and rivers across northern Ohio. Though meteorologist accurately predicted severe thunderstorms at this time the resulting flooding was not well predicted. In many areas the flooding that occurred was not expected to be as severe as it was. [F10]
Destruction from the flood was unprecedented. Estimated property damage from the flooding is around 35 million dollars. Many of the streets were turned into rivers by the influx of water requiring many motorists to be rescued from their vehicles. Property damage for the county included over 4000 homes, almost 500 businesses, and 21 public buildings [F6]
 |
| http://pubs.usgs.gov/sir/2007/5161/ |
Thunderstorms
by Emilie Alcock (ealcock2)

A looming thunderstorm in Cleveland, June 19, 2007.
http://icleveland.blogspot.com/2007_06_01_archive.html
Cumulonimbus clouds are the type of clouds that produce thunderstorms. In order for thunderstorms to form the atmosphere needs to be unstable, there has to be a source of surface moisture, a lifting mechanism, and vertical wind shear. In order for thunderstorms to be classified as severe, there must be hail at a minimum of ¾ inches, a minimum wind speed of 50 knots (58 miles per hour), and tornado formation. These storms are always accompanied by lightning and thunder, strong winds, and rain [TH 1].
In Cleveland, although the average of rainy days is 156 out of a year, thunderstorms are typically a threat about 33 days out of the year. The average precipitation is 37.2 inches [TH 2]. About 5 or 6 storms occur each month from May to August with the threat of this type of severe weather much less before and after this period.
To deal with the threat of severe spring and summer weather, such as thunderstorms, the state of Ohio has developed Severe Weather Awareness Week, which usually occurs during the last full week of March [TH 3]. The state also holds Lightning Safety Week, which occurs during the last full week of June, since lightning is the most deadly occurrence associated with thunderstorms [TH 4].
Cold Waves (Matt Beard, msbeard2)
“A cold wave is an influx of unusually cold air into middle or lower latitudes." "The actual temperature itself is not the most meaningful measure of a cold wave’s intensity and impact. Rather, it is the departure from the normal temperature that is the meteorologists measure of a cold wave.” (CW1, 224)
The winters of 1976-1977 and 1977-1978 were the coldest winters in Cleveland history. "The winter of 1976-1977 was the coldest of the two, and January 1977 was the coldest month known in Ohio." CW2 The statewide average during this month in 1977 was 11.9 degrees, which was 17 degrees below normal. CW2 January 17th was the coldest day with temperatures reaching negative 25 degrees. “The impacts of the cold were intensified by snowfall that was twice the average and a blizzard at the end of January.” This particular cold wave ended in February with 60 degree weather. CW2


 (transportation for those with disabilities), Downtown Loop (free trolleys that take passengers around town), and bikes as riding options.[T3] For those who drive, the Cleveland website lists the streets and bridges that are under construction in order to allow commuters to appropriately plan their routes. A portion of the current construction projects are listed below.


![[L6]](http://z.about.com/d/cleveland/1/0/9/1/-/-/5.jpg)
![[L7]](http://massengale.typepad.com/photos/uncategorized/2007/06/15/jacobs_field.jpg)
Comments (0)
You don't have permission to comment on this page.