..::Welcome to Dallas, TX::..


photo by Allen Matheson
all photos provided by PhotoBucket.com
City Profile
Geography
Located in north-central Texas, 70 miles south of the Oklahoma border and 174 miles west of Louisiana, Dallas is literally "deep in the heart of Texas". Covering an area of 385 square miles, 342.5 square miles of it land and 42.5 square miles of it water, Dallas makes up one-fifth of the Greater Dallas/Fort Worth Metroplex. About a quarter of Texans live in the Dallas, Fort Worth, Arlington metropolitan area. Dallas and it's surrounding communities are mostly flat and lies in an elevation range between 405 feet and 550 feet. However, along with it's flat lands comes around 60 lakes within a 100 mile radius of Dallas, which is a majority of man-made lakes. One such lake is White Rock Lake which is a significant feature of Dallas. It is a popular destination for boaters, rowers, joggers, and bikers in the surrounding neighborhoods. The 66 acre Dallas Arboretum and Botanical Garden lies on the lake's eastern shore. Another geographic feature located throughout Dallas is Trinity River. Trinity River serves as a major water way that passes through Dallas and heads southeast to Houston. This 550 mile long river did not serve as an aesthetic and recreational resource until 2000 when Dallas gave way to the Trinity River Project. This project is expected to reach full completion in 2010 and will result in lakes, new park facilities, and transportation improvements. 11
Topography
Land
Dallas is situated in part of the Great Plains 27, a flat stretch of land about 500 feet above sea level. A limestone cliff known as the Austin Chalk Formation provides the biggest noticeable change in elevation and increases the height of a large section of Dallas County by about 200 feet.
Water
The largest waterway located near Dallas is the Trinity River 10 and cradles the Dallas western and southern metropolitan area. Although it used to serve as a drainage channel, recent public protests have created a project to improve the river for recreational use. White Rock Lake and Bachman Lake, located northeast and northwest of downtown Dallas, respectively, are major attractions serving the aquatic and entertainment needs of the people. Other small lakes dot the surrounding area and provide a source of fresh water among other amenities.
Roads and Railways
Three interstate highways serve the Dallas metropolitan area: I-30, I-35E, and I-45. In addition, state expressways pan out from the middle of the city. Together, they all form a hub-and-spoke system for efficient transportation. Additionally, a light railway system connects the cities of Dallas and Fort Worth, known as “The T”.
Population
POPULATION: 17
1,192,538
Male population: 614,331
Female population: 578,207
Avg Household Makeup: 3 members per family
Total Units of Housing: 509,080
Marital Status Makeup (estimates according to 2006 census):
Married Males: 209,359
Married Females: 181,616
Ethnic Breakdown by Race:
White: 630,392
African American: 288,187
American Indian: 5,232
Asian: 27,947
Hawaiin/Pacific Islander: 748
Hispanic or Latino (any race): 513,739
Other Race: 225,641
2+ Races: 14,391


The standard of living is not extremely high so even though the median salary is $36,403, that can still allow you to own some property with the median house value being $120,900. This does not mean that the all have a stable income. 22.1% of the population in 2005 was living in what the US Census would consider to be poverty.
The median age of citizens in Dallas is 30 yrs old. This is significantly lower than the median age of citizens that live in Texas, but that could be due to the 20 universities and colleges in Dallas. 17 Dallas has a high high school graduate rate at 84.1%, but graduating with a Bachelor's Degree or equivelent is only 27%. With Latin American culture being such a large segment of the population, 19.7% of citizens over the age of 5 speak another language besides English at home. [http://factfinder.census.gov/servlet/ACSSAFFFacts?_event=ChangeGeoContext&geo_id=16000US4819000&_geoContext=&_street=&_county=dallas&_cityTown=dallas&_state=&_zip=&_lang=en&_sse=on&ActiveGeoDiv=&_useEV=&pctxt=fph&pgsl=010&_submenuId=factsheet_1&ds_name=ACS_2006_SAFF&_ci_nbr=null&qr_name=null®=null%3Anull&_keyword=&_industry=|1]
Economy/Industry
As Dallas, TX is 3rd largest city in the state and the 15th in the country, Dallas is known for being one of the busiest cities in the south. As the center of big telecommunications, Dallas provides services with more diversity and variety than most cities in the country. Competing with 3 other big cities in Texas: Austin, Houston, and San Antonio, Dallas has the most shopping malls/centers per capita than anywhere else in the country. 2 In addition to, the Dallas-Fort Worth Metroplex is one of the greatest concentrations of billionaires in the world. The city itself already houses 12 billionaires—concentrated in the Preston Hollow area of north Dallas, incorporating with the 8 billionaires who live in the neighboring city of Fort Worth, makes it the most concentrated in the state, country, and the world. 10
In the 1970s, Dallas experiences one of the biggest real estate booms. Plans for new skyscrapers, homes, and businesses led to ambitious thinking and with plans for a new transit system, money for projects became a huge issue. Although the real estate boom had a big part in the economic downfall, the Savings & Loan crisis almost shattered the city's economy. Luckily, the telecommunication industry exploded into Dallas and saved their economy and introduced Texas Instrument. 10
The city of Dallas endured an economic downfall in the 1980s. It rebounded in the 1990s, which is one of the strongest employment growth up to date. It has a diversified economic base with service industries, including trade, make up the city's most important economic sectors. Dallas continues to be an important distribution, financial, and insurance center of the Southwest. Its location in the north central part of the state and its dense network of railroads and highways enable it to serve as the shipping center for the agricultural and mineral products of the surrounding region, including cotton, livestock, fruit, petroleum, and natural gas. Dallas has the largest concentration of trade facilities in the South and Southwest. 13
''' Economic/Industrial Breakdown- in 2002:"
Manufacturing ($16,476,660,000)
Wholesale Trade ($27,729,541,000)
Retail Trade ($13,141,441,000)
Information (-) withheld
Real Estate/Rental/Leasing ($3,896,220,000)
Professional/Scientific/Technical Services ($10,990,873,000)
Administrative/Support/Waste management & remediation service ($5,523,196,000)
Educational ($160,433,000)
Health care /Social assistance ($8,546,381,000)
Arts, Entertainment & Recreation ($660,159,000)
Accommodation & Food services ($2,784,368,000)
Others ($1,930,889,000) 14
Land Use
Urban

The Dallas-Fort Worth area is one of the most densely populated, and highly urbanized areas of Texas. Over six million people live in the Dallas-Fort Worth metropolitan area,3 with population densities routinely over 2,500 people per square mile.4 Most land in Dallas is used for residential and industrial purposes. However, many people would be surprised to hear that Dallas is also a very green city. There are over 400 parks within the city limits, which account for almost 20 percent of the cities total land area.5
One of the main reasons for visiting Dallas is its downtown. The downtown fuses a diverse array of neighborhoods together into one unforgettable experience. These include the Government, Reunion, West End Historic, City Center, Convention Center, Arts, Farmers Market, Main Street, and Harwood Historic Districts. 6
The city is currently in the process of implementing its Forward Dallas program. The goal of this program is to revitalize certain areas of the city by increasing retail, industry, and attracting more businesses to the area.7 One of these projects, the Trinity River Corridor project, is aiming to add to the draw of an already spectacular downtown. The project calls for additional parks along the water, a promenade along the entire length, and additional activities, such as boat launches, and a white water course. The project will also include additional flood protection in the form of levees. 8
Agriculture
In the city of Dallas, less then one percent of industry is agriculturally based. Some of the biggest agricultural outputs are cotton, wheat, soybeans, and cattle. Most of the agricultural activities take place on the outer edge of the city and its suburbs. Once leaving the metropolitan area, farming begins almost instantly. If you live in an outer suburb, it is very likely that your backyard is a farm. 9
Rural
To find rural area around Dallas, you must travel beyond its outer suburbs. The city itself is only one percent rural. Most of the undeveloped area in the city lies to the south.
Ecology

Dallas has 406 parks with a total of 21,000 acres of parkland. Most noable is Fait Park, sporting 206 acres. 10 Deciduous and evergreen trees are common to the area. These include the deciduous trees of the Japanese Maple, the Shantung Maple, and the Texas Buckeye; and the evergreen trees of the Atlas Cedar, the Duodar Cedar, and the Leyland Cypress. Most of these trees are resistant to heat and drought. The deciduous trees generally grow best in slight shade and good soil, with the exception of the Shantung Maple, which grows in clay. They grow in a slow to moderate speed, and the leaves grow in a variety of colors in spring and turn a full spectrum of autumn shades in the fall. The evergreens grow in either rich soil or clay, and most grow best in the sun. The needles on the trees are a variety of colors, and they grow in differing speeds. 11
Roses and chrysanthemums are two flowers commonly planted throughout Texas for the spring and summer seasons. Roses fair best in temperate climates. They grow tall and need a lot of care, such as pruning and watering. 15Chrysanthemums are multifunctional: besides being nice to look at, they are used for tea, as an insecticide, and to decrease indoor air pollution. Chrysanthemums are noted for their ability to withstand wind and rain.16
Pansies and violas are typically grown in Texas in the fall. They only grow 6"-12" and last through the winter into early spring. Violas rarely reach 8" in height and last until the Christmas season. Both flowers need substantial sunlight and well-composted soil. 17
Common animals in North Texas include deer, elk, armadillos, snakes, lizards, and the cottontail rabbit.32 Some of these animals live in the forested areas of the region, while others prefer the warm, dry parts of Texas. There are also 629 species of birds, such as turkeys, eagles, hawks, bluebirds, hoot owls, waterfowls, and wrens.33 Some of these migrate in during the colder months, and some live permanently in the warmer climate.34
 |
 |
| Pansy. Photo provided by gettyimages.com |
Armadillo. Photo provided by gettyimages.com |
Climate
Temperature
In Degrees Fahrenheit
| Month |
Daily Max |
Daily Min |
Mean |
Max Daily Temp |
Min Daily Temp |
| January |
55.4 |
36.4 |
45.9 |
95 |
2 |
| February |
61.0 |
41.0 |
51.0 |
95 |
2 |
| March |
69.1 |
48.5 |
58.8 |
98 |
12 |
| April |
76.5 |
56.1 |
66.3 |
99 |
29 |
| May |
83.8 |
64.9 |
74.4 |
103 |
36 |
| June |
91.6 |
72.7 |
82.2 |
112 |
48 |
| July |
96.1 |
76.8 |
86.5 |
111 |
57 |
| August |
95.8 |
76.4 |
86.1 |
115 |
55 |
| September |
88.5 |
69.2 |
78.9 |
110 |
40 |
| October |
78.6 |
58.2 |
68.4 |
100 |
26 |
| November |
66.0 |
46.8 |
56.4 |
92 |
15 |
| December |
57.4 |
38.6 |
48.0 |
89 |
1 |
| Annual |
76.7 |
57.1 |
66.9 |
115 |
1 |
18

19
Rainfall
Precipitation Data in Inches
| Month |
Mean |
Median |
Extreme |
Year |
Snow |
| January |
1.89 |
1.93 |
5.49 |
1998 |
0.7 |
| February |
2.31 |
2.09 |
7.91 |
1997 |
0.6 |
| March |
3.13 |
2.65 |
9.09 |
1977 |
0.0 |
| April |
3.46 |
3.40 |
8.05 |
1997 |
0.0 |
| May |
5.30 |
5.91 |
10.56 |
1989 |
0.0 |
| June |
3.92 |
2.97 |
10.87 |
1989 |
0.0 |
| July |
2.43 |
2.06 |
6.14 |
1988 |
0.0 |
| August |
2.17 |
1.79 |
5.98 |
1974 |
0.0 |
| September |
2.65 |
2.30 |
7.16 |
1974 |
0.0 |
| October |
4.65 |
3.43 |
16.05 |
1981 |
0.0 |
| November |
2.61 |
2.14 |
7.01 |
2000 |
0.2 |
| December |
2.53 |
2.02 |
9.25 |
1991 |
0.2 |
| Annual |
37.05 |
36.98 |
|
|
|
21

20
Average Percent Possible Sunshine
| Jan |
Feb |
Mar |
April |
May |
June |
July |
Aug |
Sep |
Oct |
Nov |
Dec |
Ann |
| 53 |
54 |
60 |
62 |
59 |
67 |
76 |
73 |
69 |
62 |
57 |
52 |
62 |
22
Heating Degree Days
| |
Jan |
Feb |
Mar |
Apr |
May |
Jun |
Jul |
Aug |
Sep |
Oct |
Nov |
Dec |
Year |
| °C |
372 |
268 |
158 |
41 |
0 |
0 |
0 |
0 |
0 |
28 |
152 |
314 |
1337 |
| °F |
670 |
482 |
284 |
74 |
0 |
0 |
0 |
0 |
0 |
50 |
274 |
565 |
2407 |
23
Cooling Degree Days
| |
Jan |
Feb |
Mar |
Apr |
May |
Jun |
Jul |
Aug |
Sep |
Oct |
Nov |
Dec |
Year |
| °C |
0 |
2 |
16 |
50 |
136 |
266 |
349 |
342 |
206 |
66 |
6 |
2 |
1446 |
| °F |
0 |
4 |
29 |
90 |
245 |
479 |
628 |
616 |
371 |
119 |
11 |
4 |
2603 |
24
Dallas, Texas is located in the eastern, Humid Subtropical region of the state where hot summers are very common: the average length of the warm season (freeze-free period) is about 249 days and summer daytime temperatures frequently exceed 100 degrees Fahrenheit. Winters are very mild with short-lived periods of sudden drops in temperature that occur about three times a month. Aside from such disturbances, the temperatures during the winter do not go very low, as shown in the first table. In fact, one of the lowest recorded minimum temperatures during the winter was in 1977 with 29.8 degrees Fahrenheit. January is known to be the coldest month while July is known to be the warmest month. 31
Precipitation is not very common within this region either; aside from the one to two day rainy weathers, the annual precipitation is, for the most part, from thunderstorms. Snowfall, hail, and other types of precipitation other than rain are rare.
On a more extreme note, with its close proximity to the Gulf of Mexico, Dallas is vulnerable to the destruction of tornadoes. 80 tornadoes have been recorded between 1950 and 2007. 26
Transportation Systems
Photo provided by http://www.smart-traveler.info
The city of Dallas has a large number of interstate highways. Interstates 20,30, and 35E go all throughout the city. Since most people in Dallas use cars to get around, this is very convenient. Interstate 20 in Texas, a major east-west interstate highway in the southern United States, runs from interstate 10 east of Kent, Texas, through the Dallas-Fort Worth metroplex to the border with Louisiana. Interstate 35E , is the eastern half of Interstate 35 where it splits into different cities in Texas. I-35 splits into two branch routes, I-35W and I-35E at Hillsboro. I-35E runs north for 97 miles (156 km), and keeps these keeps these sequences of exit numbers. It runs through Dallas before rejoining with I-35W to reform I-35 in Denton.
Here is a list of all the interstate highways in Texas:
Primary Interstate Highways
Highway Location Length Description Date established Notes
I-10 El Paso, Hudspeth, Jeff Davis, Reeves, Pecos, Crockett, Sutton, Kimble, Kerr, Gillespie, Kendall, Bexar, Guadalupe, Caldwell, Gonzales, Fayette, Colorado, Austin, Waller, Harris, Chambers, Jefferson and Orange counties 878.6 miles (1,414.0 km) I-10 enters the state from New Mexico northwest of El Paso, passing through rural West Texas on its way to San Antonio, where it has junctions with I-35 and I-37. It continues east to Houston, where it has a junction with I-45, then enters Louisiana near Orange. I-10 is the state's longest Interstate Highway as well as its southernmost east-west Interstate Highway.1959
I-20 Reeves, Ward, Crane, Ector, Midland, Martin, Howard, Mitchell, Nolan, Taylor, Callahan, Eastland, Erath, Palo Pinto, Parker, Tarrant, Dallas, Kaufman, Van Zandt, Smith, Gregg and Harrison counties 636.1 miles (1,023.7 km) I-20 begins at exit 186 on I-10 in West Texas and heads towards the northeast. The highway is a major east-west corridor through the Dallas–Fort Worth Metroplex, the Dallas and Fort Worth combined metropolitan areas, where it has junctions with I-30, I-35W, I-35E and I-45. I-20 passes through East Texas before it enters Louisiana east of Marshall.1959
I-27 Lubbock, Hale, Swisher, Randall and Potter counties 124.1 miles (199.8 km) I-27 begins at State Highway Loop 289 in southern Lubbock and heads north in the Texas Panhandle. It ends at exit 70 on I-40 in Amarillo.1969
I-30 Parker, Tarrant, Dallas, Rockwall, Hunt, Hopkins, Franklin, Titus, Morris and Bowie counties 223.7 miles (360.1 km) I-30 begins at exit 421 on I-20 in the western portions of the Dallas–Fort Worth Metroplex, the Dallas and Fort Worth combined metropolitan areas. As it heads east through the Metroplex, it has junctions with I-35W, I-35E and I-45. After leaving the Metroplex, the highway heads towards the east-northeast and enters Arkansas at Texarkana.1959
I-35 Webb, La Salle, Frio, Medina, Atascosa, Bexar, Guadalupe, Comal, Hays, Travis, Williamson, Bell, Falls, McLennan, Hill, Denton and Cooke counties 407.2 miles (655.3 km) I-35 begins at the United States-Mexico border in Laredo and heads north towards San Antonio. In San Antonio, it intersects I-10 and I-37 before heading north to Austin, the state capital. North of Hillsboro, the highway splits into two branches, I-35W which heads to Fort Worth and I-35E that heads to Dallas. The two branches reunite in Denton and I-35 heads north, entering Oklahoma north of Gainesville.1959
I-35E Hill, Ellis, Dallas and Denton counties 96.8 miles (155.7 km) I-35E is the eastern and less direct branch of I-35 from Hillsboro to Denton; it passes through Dallas, where it intersects I-20 and I-30.1959
I-35W Hill, Johnson, Tarrant and Denton counties 85.2 miles (137.1 km) I-35W is the western and more direct branch of I-35 from Hillsboro to Denton; it passes through Fort Worth, where it intersects I-20 and I-30. 1959
I-37 Nueces, San Patricio, Live Oak, Atascosa and Bexar counties 143.0 miles (230.1 km) I-37 begins in Corpus Christi near the Gulf Coast and heads towards the north-northwest. It intersects I-10 before it ends at exit 158 on I-35 in San Antonio. 1959
I-40 Deaf Smith, Oldham, Potter, Carson, Gray, Donley and Wheeler counties 177.1 miles (285.0 km) I-40 crosses the Texas Panhandle from New Mexico to Oklahoma, and has a junction with I-27 in Amarillo. The alignment of I-40 is the approximate alignment of the historic U.S. Highway 66 (US 66). 1959
I-44 Wichita County 14.8 miles (23.8 km) I-44 begins in Wichita Falls and heads north to Oklahoma. 1982
I-45 Galveston, Harris, Montgomery, Walker, Madison, Leon, Freestone, Navarro, Ellis and Dallas counties 284.9 miles (458.5 km) I-45 begins in Galveston at the Gulf Coast and heads north intersecting I-10 in Houston. It passes through East Texas and intersects I-20 before ending at exit 46 on I-30 in Dallas. 1959
Dallas Area Rapid Transit (DART) is a system of HOV systems, trains and buses that go all around the city. DART was the first light weight transit system in the southwest United States. The Red Line runs through Oak Cliff, south Dallas, downtown, uptown, north Dallas, Richardson and Plano. The Blue Line runs through south Dallas, downtown, uptown, east Dallas, Lake Highlands, and Garland.
Another train system that exists within Dallas is in Fort Worth called The Trinity Express that connect to the Union Station in downtown Dallas.
Dallas has one major commercial airport and it is called Dallas/Fort Worth International Airport . This airport's code is DFW and it is the 4th largest airport in the United States. DFW Airport opened for commercial service on January 13, 1974. The original name was Dallas Fort Worth Regional Airport. Dallas/Fort Worth International Airport has five terminals and can hold up to 260 gates. American Airlines, United Airlines, and many other international airlines fly through this airport. Each terminal accomodates a different airline so that it doesnt become over crowded.
City Profile References
1 US Census for Dallas, TX
2 Dallas Observer- Best of Dallas
3 http://www.census.gov/population/www/estimates/metro_general/2006/CBSA-EST2006-01.xls
4 http://www.city-data.com/county/Dallas_County-TX.html
5 http://www.dallasparks.org/Parks/parksmain.aspx
6 http://www.downtowndallas.org/DiscDwnTwnMap.pdf
7 http://www.forwarddallas.org/
8 http://www.trinityrivercorridor.com/html/vision_plan.html
9 http://www.nass.usda.gov/Statistics_by_State/Texas/Publications/County_Estimates/CE_maps/index.htm
10 http://en.wikipedia.org/wiki/Dallas
11 http://dallas-tx.tamu.edu/hort/Plants+for+Dallas+County/Plants+for+Dallas+County.htm
12 http://www.dallasxl.com/geography/
13 Dallas City Economy
14 Dallas,Texas Economic & Business Data
15 http://en.wikipedia.org/wiki/Roses
16 http://en.wikipedia.org/wiki/Chrysanthemums
17 http://www.city-data.com/city/Dallas-Texas.html
18 http://drought.unl.edu/whatis/climographs/DallasANC.htm
19 http://drought.unl.edu/whatis/climographs/DallasANC.htm
20 http://web2.airmail.net/danb1/annualrainfall.htm
21 http://drought.unl.edu/whatis/climographs/DallasANC.htm
22 http://www.met.utah.edu/jhorel/html/wx/climate/sunshine.html
23http://www.worldclimate.com/cgi-bin/data.pl?ref=N32W097+1306+412242C
24 http://www.worldclimate.com/cgi-bin/data.pl?ref=N32W097+1308+412242C
25 http://www.srh.noaa.gov/fwd/CLIMO/dfw/monthly/dwinter.html
26 http://web2.airmail.net/danb1/texas_climate_descriptions.htm
27 http://www.city-data.com/states/Texas-Topography.html
28 http://en.wikipedia.org/wiki/Dallas%2C_Texas
29 www.smart-traveler.info
30 csc.web.cern.ch
31 http://www.weather.com/outlook/travel/businesstraveler/wxclimatology/monthly/USTX0327
32 http://www.tpwd.state.tx.us/exptexas/programs/expo/expo2006/activities/wildlife/
33 http://www.heardmuseum.org/attractions/birding.asp
34 http://en.wikipedia.org/wiki/List_of_Texas_birds
35. http://en.wikipedia.org/wiki/Interstate_45
..::Dallas Meteorology Center::..

Photo from flickr
Thunderstorms
by Jonathan Chao (jchao4)
Overview
Thunderstorms are one of the most common weather phenomena that occur in the world. Many people experience these events on a weekly basis and grow accustomed to them, however they still have the potential for becoming one of the most destructive and frightening encounters in a very short amount of time. There are two types of thunderstorms: regular and severe. They occur in almost all parts of the world, but are most common in tropical rainforests and most dangerous in the central region of the United States. Many other important weather phenomena also stem from thunderstorm development such as tornadoes, hazardous lightning, hail, and others. Almost all thunderstorms develop through a cycle consisting of the cumulus stage, mature stage, and the dissipating stage. Th1

This animation displays the total amount of reported severe thunderstorms from 1950 – 2002 during January - October Th6
Development
Severe thunderstorms require four key ingredients required to begin and sustain its development. The first ingredient is a source of moisture. Moisture in the lower troposphere provides the main energy that fuels a storm. As warm air from the surface rises, it cools. As the moisture in the air parcels condenses, they may begin to form cumulonimbus clouds, which is the main constituent of any storm. Next, the environment needs to be unstable. Instability in the atmosphere provides the necessary temperature difference for warm air near the surface to rise into the cooler air and condense. Another element required for severe thunderstorm formation is vertical wind shear. Vertical wind shear acts to separate the updraft from the downdraft and allows the storm to gain more energy. Without this wind shear, many storms would not become severe because the downdraft of a storm would directly counter the updraft and cut off the source of energy for the thunderstorm. The last ingredient required is something to generate the updraft in a thunderstorm. This can be caused by many factors including differential heating of air over different surfaces, land features, or air outflow from a previous thunderstorm. The lifting allows the warm air parcels to rise and form the cumulonimbus clouds which are able to support lightning, hail, and heavy rain.
These storms may organize into different types. Three major kinds of severe thunderstorms are mesoscale convective systems, frontal squall lines, and supercells. The most potentially devastating type of storm is the supercell, which produces most of the tornadoes, hail, and hazardous lightning associated with thunderstorms.
Lightning

Lightning over Dallas Th7
Lightning is one of the most spectacular sights to observe. It is seen time and time again occurring with thunderstorms, but they can also form along with many other natural events such as volcanoes and heavy snowstorms. Although the true origins and causes are unknown, lightning is fundamentally static electricity that occurs on a very large scale. During a thunderstorm, ice and water particles that drift upwards in the updraft and downwards in the downdraft inside of a cumulonimbus cloud tend to strike each other. Each time a strike occurs there is a miniscule transfer of electrons. These electrons tend to collect on the descending particles and create a charge separation directly in the cloud. Since the atmosphere acts as an excellent insulator, the charge difference between two areas must build to an extreme level to release lightning. There are many places where a charge difference can release lightning. Therefore, lightning can interact between the ground and the clouds, within a cloud itself, between a cloud and a skyscraper, etc. Th2
Thunder is produced as a direct result of the heating of air during a lightning strike. A single bolt of lightning can produce as much heat as 5x the surface of the Sun. Therefore, as the air around the bolt heats rapidly, it expands and creates a shockwave and humans perceive these shockwaves as thunder. Th2
Each year, lightning kills over 1,000 people. It is a very dangerous hazard that people should be warned about. Although the odds of dying from lightning is very low (not to mention that it varies by region), it is still the #2 killer in the United States annually. Th3
Effects on Dallas
Dallas sees its fair share of thunderstorms, mostly during the months of April, May, and June. Cool fronts that arrive from Canada collide with warm air from the Gulf of Mexico and create atmospheric instability along with the lifting mechanism for many storms. Although Texas does not hold the record for the amount of thunderstorms (that title is given to Florida), the storms in this region are some of the deadliest in the nation.

This map illustrates the amount of thunderstorms in the nation per year Th4
In May of 1995, an isolated severe thunderstorm that formed near Fort Worth, Texas wreaked havoc on the surrounding counties. The supercell responsible for the destruction produced grapefruit sized hail and very high winds. As it moved towards Dallas, a nearby squall line merged with the storm and killing over twenty people through lightning, flash flooding, and high winds. It proved to be a very costly disaster with numbers estimated to be in the billions. Th5
References
Th1 http://www.windows.ucar.edu/tour/link=/earth/Atmosphere/tstorm.html
Th2 http://www.csmfoundation.org/Div_Lightning.html
Th3 http://www.lightningsafety.noaa.gov/resources/Ltg%20Safety-Facts.pdf
Th4 http://earthstorm.mesonet.org/materials/graphics/TstormFreq.gif
Th5 http://www.weather.com/encyclopedia/thunder/ftworth.html
Th6 http://www.spc.noaa.gov/climo/online/grids/index.html
Th7 http://www.flickr.com/photos/markgraham/150915654/
Tornadoes
By: Jessica Carnate (jcarna2)
Overview
Compared to other states, Texas ranks number 1 for frequency of tornadoes, number of tornadoes by state, number of deaths, injuries, and cost of damages.To1 In 1970, Texas had a population of 11,198,655 and between 1950 and 1995 Texas had 5,722 tornadoes. The population in 1970 divided by the number of tornadoes equals 1,957. This ranks Texas number 8 in the ratio of tornadoes to population. Texas had 478 fatalities between 1950 and 1995. Between 1950 and 1995, Texas had 7,554 injuries involving tornadoes. The risk of death in any one year is 1 in 1,054,267. This ranks Texas as number 7 for the risk of death by tornadoes. Total cost of tornadoes between 1950 and 1995 was $1,986,918,400.00. The cost per person for tornadoes in Texas per year is $ 3.94. In an average year, 800 tornadoes are reported nationwide, resulting in 80 deaths and over 1,500 injuries.To2
According to the tornado alley map that is provided in the slideshow above, the reason why the tornado alley exists in mid-USA, including Dallas, is because of the presence of a jet stream, warm-moist air from the southeast, warm-dry air from Mexico and the south, and cold-dry air from the mountains and northwest. With low pressures jus northwest of tornado alley, these ingredients brew up excellent super cell thunderstorms, which develop tornadoes, hail and lightning storms as well. To5 Tornadoes are measure using the Fujita Scale, as seen bellow.
|

|
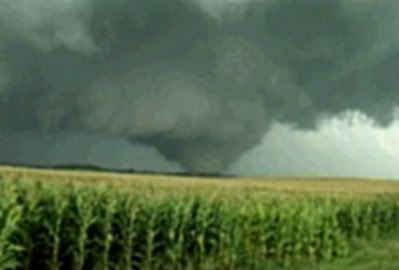 |
Tornadoes come in many forms, including funnels and spouts, but Texas, or Dallas to be more specific, mostly gets hit by the wedge tornado. The wedge is straight on the sides not funnel shaped and has a broad damage path. It's usually as wide, or wider than it is tall. Not necessarily stronger than funnels or other shaped tornadoes, but they do cover much more ground, which can be very destructive in Dallas County. Although this tornado lacks the typical funnel or classic tornadic appearance, massive funnels like this one that are a mile wide are unrecognizable at close range, but tend to appear as a boiling wall of fog approaching. Generally the rain stops and the tornado presents itself a rapid appearance. These storms are the ones that are generally blamed for "striking without warning". To2
For the Dallas-Fort Worth Metroplex, there have been tornadoes that have been recorded or unsubstantiated throughout the region with hail up to 8.5 cm in size and wind gusts up to 80 mph (130 km/h). To1 Between 1950 and 1995, 66 tornadoes hit Dallas County. The most devestating of these was an F3 that hit on April 2, 1957. This storm killed ten people and injured 200. It’s the most renowned tornado well-known to date because it was the most photographed or filmed tornado at the time.To3
Case Study- The 1957 Dallas Tornado
The Dallas tornado is quite historically significant. By the time of its first appearance the rains that preceded it mostly had passed on, so that the air was washed clean and the funnel was not particularly obscured by precipitation. Rainfall from the thunderstorm that gave it life also was generally sparse. Although sky conditions were overcast and threatening, there were no especially low clouds to impede viewing. The tornado did not strike in a sparsely populated rural location, but rather in the middle of a relatively large metropolitan area. It did not strike at night, but late on a Tuesday afternoon when many people were out and about to witness it. This phenomena lasted April 2-4th, 1957 and was rated an F4.To3
On April 2nd, 1957, a low pressure system was set over the Oklahoma and Texas region and the warm front from Arkansas and a cold front from El Paso situated in northern Texas. Temperatures on that day reached the 70s in northern Texas with dewpoints in the upper 60s to near 70s. So a substantial wind shear provided additionnal fuel for the development of supercellular storms across the region. At around 4:30 CST, a tornado touched down in southern Dallas County and nearly 600 structures were damaged including over 100 homes and a dozen apartment buildings, along with some businesses and schools. The fatality number for the date is up to 19 people and over 200 injured. The cost of damage was estimated at around $4 million (in 1957 dollars). One interesting fact about this event was that all air and debris flow inward into the funnel and then upward, but on the outside edges of the funnel debris and people were even lifted. In conclusion, this phenomena left the city of Dallas in dismay and in despair. Although we know Dallas and the state of Texas as number 1 in frequency of tornadoes, the 1957 tornado still ranks #1 in destruction. To4
References
To1 http://www.disastercenter.com/texas/tornado.htm
To2 http://www.beer-bytch.com/tornados.htm4
To3 http://www.1957dallastornado.net/
To4 http://en.wikipedia.org/wiki/Dallas_tornado_outbreak_of_April_1957
To5 http://en.wikipedia.org/wiki/Tornado#Shape
Downbursts
Kayla Kramer (kkramer5)
Overview
Downbursts occur when rain-cooled air hits ground level during a thunderstorm and spreads in all directions to produce strong winds. They vary from wet to dry and from macro to mini and cause wind shear, resulting in danger in aviation. Winds often exceed 150 mph. Generally they stretch to 2.5-4 miles, but larger ones have been known to reach 200 miles. These storms are ten times as frequent as tornadoes. D1 Downbursts last for 5-30 minutes. They differ from tornadoes in that they blow wind outward rather than outward. As a result, winds blow debris out ward rather than sucking it in. D2 Downbursts generally occur in storm season, which for the area occurs in the spring and summer seasons. D3 In Texas, downburst winds are able to reach 100 mph, and they are much more common than tornadoes. D4 Downbursts have caused several fatal plane crashes since the development of commercial aviation in 1975. These accidents happen when a strong headwind suddenly shifts into a tailwind during the plane’s landing or takeoff, which causes a loss of lift and in some cases an aerodynamic “stall.” The catalysts of such a storm are “nearly dry-adiabatic subcloud lapse rates, high CAPE, a large vertical difference of vertical potential temperature, and low middle-troposphere relative humidity.” D5
Case Study
The Dallas storm occurred on August 2, 1985. This storm was classified as a hybrid microburst, created from the mixing of “water-loading” and mid-level evaporation near the melting level. D5 On this date, Delta Air Lines Flight 191, a Lockheed 1011 arriving from Fort Lauderdale, FL crashed at DFW Airport, killing 8 of 11 crew members, 126 of 152 passengers, and 1 person on the ground for a grand total of 135 deaths, as well as 27 injuries. 29 people survived. The crash was directly caused by microburst-induced wind shear. Captain Edward Conners had become alarmed when a thunderstorm developed in front of the plane in Louisiana, and he took the appropriate actions to change the plane’s headings and avoid the storm. Upon reaching DFW, the plane encountered an isolated thunderstorm, but the captain judged that it was not a great enough risk to attempt to avoid. Unfortunately, the plane got caught in a microburst. At 800 feet above ground level, the plane suddenly accelerated from 149 knots to 173 knots. First officer Price attempted to control the speed. The airspeed suddenly dropped from 173 knots to 133, and then to 119. Price tried to avoid a stall by pushing the nose of the plane downwards, and the aircraft’s vertical speed reached 1700 ft/min and hit the ground 6,300 feet north of the runway, bounced, and crashed into a vehicle on State Highway 114, killing the driver. The plane skidded into two 4-million gallon water tanks at 220 knots and burst into flames. The survivors were mainly in the rear smoking section, which separated from the plane before collision with the water tanks.D6
References
D1 http://en.wikipedia.org/wiki/Downburst
D2 http://dentoncounty.com/dept/main.asp?Parent=82&Link=84
D3 http://www.usatoday.com/weather/wds5.htm
D4 http://www.srh.noaa.gov/fwd/school_wrkbk.pdf
D5 http://ams.allenpress.com/
D6 http://en.wikipedia.org/wiki/Dallas-Fort_Worth_International_Airport
Hail
Raphael Chavez _ rchavez3
Overview
The Dallas/Fort Worth area is a prime location for severe weather. Its location is the key meeting place of cool fronts from Canada and warm, humid air from the Gulf Coast. When these two boundaries collide, supercells form often producing 3/4” size hail, winds greater than 50 knots, and tornadoes. Although more than of these elements are present at one time during a severe storm, Dallas/Fort Worth experiences hailstorms on about 2-3 days a year. The hail forms in the storms main updraft, where the clouds are in a “supercooled” form. Hail sizes produced range from pea size to softball size causing moderate to severe damage. The total amount of damage has succumbed to approximately 1 billion dollars at times such as with the hailstorm from April 5, 2003.
Hail damage from such storms are throughly analyzed to produce an accurate mapping of the hail sizes and direction of hailfall from the storm. Sizes of hailstones were estimated from the marks and dents left on various items. Another mode of analyzing the severity of the hailstorms was by using the Hail Detection Algorithm (HDA). The HDA uses an analysis of a vertical integration of temperature-weighted radar reflectivity. Through this data, hail sizes are estimated and hailstorms forecasted.
The most recent severe weather to hit the Dallas/Fort Worth area occurred on April 18, 2008. The string of supercells produced golf ball sized hailstones. Officials in Mineral Wells, Texas (west of Dallas/Fort Worth) reported hail damaged police cars. In Fort Worth, the Main Street Arts Festival closed early due to the storm.
Case Study: The Dallas-Fort Worth, Texas Hailstorm - 5 April 2003
This hailstorm was the result of three supercells that tracked across Northern Texas and extended about 400 miles across the state near Snyder, Texas to Texarkana, Texas. The first supercell developed in West Texas and moved eastward, north of a stationary front. The second and third supercell formed westward of the initial storm. The formation of these storms were the result of stationary front that had cool easterly winds north of the front and moist southerly winds to the south that clashed with a dryline that sat along the Texas/ New Mexico border.
The hail dropped from this storm was up to baseball size stones that resulted in nearly one billion dollars of hail damage, making it the sixth costliest storm in Texas history. An insurance study shows that after reviewing 77,000 insurance claims in 115 zip codes, almost 95 percent of asphalt shingle roofs were damaged.
 |
 |
| Visible satellite imagery showing the development of three supercells shown in the image on the right. |
Radar reflectivity showing the three supercells with the supercell in west Texas moving eastward towards hook echoes traveling eastbound. Dallas-Fort Worth. |
 |
 |
| Hailstones to 2 inches in diameter and resulting roof damage |
Plot of direct and indirect mesurements of 359 hail size locations in Flower Mound, Texas. in northern parts of Dallas-Fort Worth from supercells A, B, and C. |
El Niño
ereilly2

Overview
El Niño is the term used to describe the abnormal warming of ocean temperatures in the eastern Pacific Ocean, especially along the coasts of Peru and Ecuador. On average, an El Niño episode will occur about every two to seven years, and last from one to three years. The effect of El Niño is strongest in the winter because this is when the Pacific is at its warmest temperatures. The warming of the Pacific Ocean causes weather around the world to differ from long-term averages.
Normal Conditions
In a normal year, a surface high is positioned off the coast of South America, and a surface low is stationed around Australia. Due to the close proximity to the equator, and this pressure gradient, the winds, called the trade winds, will blow from east-to-west, across the Pacific Ocean. The trade winds help push water across the Pacific, causing it to build up in the west. The additional water in the western Pacific causes the warm water near the surface to descend down, creating a deep warm pool off the coast of Australia. On the other side of the Pacific, cold water is being pulled up from the bottom of the ocean to replace the water being displaced due to the trade winds. This process is known as upwelling. Finally, due to the surface high, subsidence is occurring in the eastern Pacific, which will lead to clear skies and drier conditions. While convection is occurring in the west, causing the formation of clouds and rain. The trade winds, and the rising and sinking of air above the surface pressures, are part of an overall circulation known as the Walker Cell. The Walker Cell generally has east-to-west winds at the surface and west-to-east winds in the upper atmosphere. The change in intensity of the Walker Cell is what leads to an El Niño or La Niña event.
El Niño Condtions
For reasons not yet known, the Walker Cell’s intensity will oscillate, like a sine curve, between high and low intensity. This change is called the Southern Oscillation, and determines whether La Niña, El Niño, or normal weather patterns will develop. In an El Niño year, the Walker Cell is weaker than average. When this is the case, the surface low and the surface high will both decrease in intensity, leading to a drastic reduction, or even reversal, of the trade winds. Weaker trade winds allow the build up of warm ocean water to slosh back to the east. This causes a deep layer of warm water to exist across the entire Pacific Ocean. Generally, the temperatures in the eastern Pacific will be four to six degrees (Celsius) warmer in an El Niño period. Upwelling is effectively stopped when this occurs and the weak winds allow the low to drift in the central and eastern Pacific Ocean. This leads to a series of events that alter global weather. EN1

Effects on Dallas
How does El Niño affect Dallas, Texas? When in an El Niño season, the jet stream moves northward from its normal position around Washington. In addition, a subtropical jet stream develops across the southern United States. The subtropical jet stream is what brings cooler temperatures and additional precipitation to the southeastern US in the winter. Dallas experiences a larger number of severe weather events, such as supercell thunderstorms and tornadoes, due to favorable conditions from the location of the subtropical jet stream (high wind shear, divergence aloft). Due to its proximity to the Gulf of Mexico, thunderstorms can be quite severe in Dallas to begin with. El Niño enhances the already deadly nature of these storms. El Niño also produces conditions, which are not favorable to the development of Atlantic hurricanes. This reduces the risk of Dallas getting hit with the remnants of a hurricane, and the torrential rain and flooding that can result. If an El Niño pattern is in effect for too long, severe flooding could result in Dallas, due to the Trinity River running right through the downtown. There is also the potential for above average property damage, due to more severe weather. In addition, vital industries, such cattle farming and agriculture, can be adversely impacted with too much rain. The cooler temperatures can also create havoc due to the greater chance of getting freezing precipitation. EN2
La Niña
There is another phenomenon, known as La Niña, which is the opposite of El Niño. It occurs when the Walker Cell is stronger than average, causing an increase in upwelling off the coast of South America, cooling ocean temperatures in the region up to seven degrees Celsius. This results in dry, warm winters for Dallas and the southeastern US. A La Niña event creates more favorable hurricane conditions in the Gulf. Prolonged exposure to a La Niña weather pattern can lead to drought like conditions in the Dallas area, again wreaking havoc on local agriculture. A La Niña event generally lasts nine month to a year and is most intense during the winter month, like El Niño. As of April 2008, we are in a La Niña weather pattern. EN3
 |
 |
| Chart showing how conditions around the world vary during an El Niño year |
This chart shows that rainfall is greater on average in Texas during an El Niño year |
References
EN1 http://faculty.washington.edu/kessler/occasionally-asked-questions.html
EN2 http://www.cpc.ncep.noaa.gov/products/predictions/threats2/enso/elnino/tx_bar.html
EN3 http://www.pmel.noaa.gov/tao/elnino/la-nina-story.html
Tropical Cyclones
By: Melissa Zieff (mzieff2)

 Since the Sixteenth Century, hurricanes and tropical storms have hit Texas in the time from June 2nd and November 5th. Below is a list of tropical cyclones that have struck or come close (within 50 miles of) the Texas coast since 1871. They are divided up by their month of occurrence. This list does not include storms that strike Mexico like Gilbert or those that cross Mexico from the East Pacific Ocean, like Lidia in 1991, mainly because Pacific storms were rarely documented prior to 1966.
|
Hurricane/Tropical Storm Strikes and Near Strikes (1871-1999)
|
| |
Jun
|
Jul
|
Aug
|
Sep
|
Oct
|
Total
|
|
Hurricanes
|
10
|
5
|
17
|
13
|
4
|
49
|
|
Trop. Storms
|
9
|
6
|
9
|
13
|
2
|
39
|
|
Nearby Hurricanes
|
0
|
0
|
3
|
3
|
0
|
6
|
|
Nearby T.S'.s
|
1
|
1
|
3
|
4
|
1
|
10
|
| |
|
|
|
|
|
|
|
Total Systems
|
20
|
12
|
32
|
33
|
7
|
104
|
The lack of storms prior to 1829 is due to sparse population across the study area and few surviving records. Many ships that may have encountered these tempests took their encounters with them to the bottom of the Gulf of Mexico. The following chart lists storm strikes from 1851 onward, by decade.
|
Tropical Cyclone Strikes
By The Decade
|
|
Decade
|
Hurricanes
|
T.S.'s
|
Total
|
|
1850's
|
2
|
2
|
4
|
|
1860's
|
4
|
2
|
6
|
|
1870's
|
2
|
4
|
6
|
|
1880's
|
6
|
2
|
8
|
|
1890's
|
3
|
2
|
5
|
|
1900's
|
4
|
2
|
6
|
|
1910's
|
7
|
1
|
8
|
|
1920's
|
3
|
2
|
5
|
|
1930's
|
4
|
7
|
11
|
|
1940's
|
10
|
5
|
15
|
|
1950's
|
3
|
6
|
9
|
|
1960's
|
3
|
3
|
6
|
|
1970's
|
3
|
7
|
10
|
|
1980's
|
6
|
3
|
9
|
|
1990's
|
1
|
5
|
6
|
|
Totals
|
55
|
49
|
104
|
Pressure. The stronger a hurricane gets, the lower the storm's central pressure becomes. Below is a list of the ten lowest pressures measured from hurricanes inTexas.
|
Pressure
|
Date
|
Location
|
|
27.83"
|
8/13/1932
|
East Columbia
|
|
27.89"
|
8/03/1970
|
Ingleside
|
|
28.00"
|
8/18/1916
|
Kingsville
|
|
28.02"
|
9/05/1933
|
Brownsville
|
|
28.07"
|
9/20/1967
|
Brownsville
|
|
28.10"
|
8/30/1942
|
Seadrift
|
|
28.14"
|
8/17/1915
|
Velasco
|
|
28.44"
|
9/08/1900
|
Galveston
|
|
28.50"
|
9/14/1910
|
South Padre Island
|
|
28.52"
|
6/27/1957
|
Port Arthur
|
**Winds.**** Some of the strongest hurricanes to affect the coast of the United States have hit the shores of Texas. Below is a chart indicating the highest wind gusts from hurricanes that have occurred in the state.
|
Highest Gusts
|
Location
|
Date
|
|
180 mph
|
8/03/1970
|
Aransas Pass
|
|
175 mph
|
9/11/1961
|
Port Lavaca
|
|
161 mph
|
8/03/1970
|
Corpus Christi
|
|
150 mph
|
8/17/1875
|
Indianola
|
|
138 mph
|
8/10/1980
|
Port Mansfield
|
|
136 mph
|
9/20/1967
|
Port of Brownsville
|
|
135 mph
|
10/3-4/1949
|
5 mi west of Freeport
|
|
135 mph
|
8/26/1945
|
Collegeport
|
|
132 mph
|
7/27/1943
|
Houston
|
|
125 mph
|
9/4-5/1933
|
Brownsville
|
|
125 mph
|
9/7-8/1900
|
Galveston
|
A tropical cyclone gets its energy from the heat released when moist air rises and the water vapor it stored condenses. Hurricanes are fueled by a different heat mechanism than other cyclonic windstorms such as nor'easters, European windstorms, and polar lows, and thus they are classified as "warm core" storm systems.
For a major hurricane, it is typical for three dozen houses to be destroyed and insured losses to total $60 million dollars. Inland flooding often leads to evacuation of homes as well as drought.

TC1:http://www.srh.noaa.gov/lch/research/txhur.php
TC2:http://www.texas-city-tx.org/HurricanesStat.htm
TC3:http://images.google.com/imgres?imgurl=http://weathersavvy.com/Hurricane_Katrina.jpg&imgrefurl=http://weathersavvy.com/Q-Hurricanes_Global_Warming.html&h=313&w=440&sz=28&hl=iw&start=15&sig2=QLGDcEP53HtpzQwKsASI9w&um=1&tbnid=m3az11OI23-hVM:&tbnh=90&tbnw=127&ei=gl8iSJrTGY7aiAGJ88GBBA&prev=/images%3Fq%3Dhurricanes%2B%26um%3D1%26hl%3Diw%26lr%3D
TC:http://images.google.com/imgres?imgurl=http://www.tdi.state.tx.us/consumer/storms/artwork/hdamage.jpg&imgrefurl=http://www.tdi.state.tx.us/consumer/storms/hsplash.html&h=439&w=587&sz=108&hl=iw&start=15&sig2=WpacgS5sgWIW8qTT8s0SIw&um=1&tbnid=JLNBkacFj3RMUM:&tbnh=101&tbnw=135&ei=xV8iSPPlCKGSigGD2rmBBA&prev=/images%3Fq%3Dhurricane%2Bin%2Btexas%26um%3D1%26hl%3Diw%26lr%3D
Heat Waves
by Bomy Kim (bomykim2)
Overview
What are Heat Waves?
Heat waves are extended periods of time with abnormally hot and humid weather with an unusually high heat index (http://www.weather.com/ready/heat/). These periods usually last between a few days to a week (http://www.co.pasquotank.nc.us/departments/911/webpage/heatwaves.htm) . However, this is not to say that extreme cases do not occur where they last up to several weeks because there are several events on record that have reached these long periods of time. A weather condition is seen to be a heat wave when the temperature of a region rises 10 degrees or more above the normal high temperature of the region. Further, it is during the summer when most heat waves occur in the US.


This image shows the levels of radiation which further shows the levels of heat over the US.
http://earthobservatory.nasa.gov/Newsroom/NewImages/images.php3?img_id=17366
How do they form?
This weather condition forms when air masses remain stationary over a region. For instance, in the Southwest desert region in the US, when hot dry air masses remain stationary over it, this causes the entire atmosphere of the region to lack moisture, while in the region near the Gulf of Mexico, hot humid air masses lead to conditions completely opposite of the Southwest desert with high levels of moisture in the atmosphere (http://www.co.pasquotank.nc.us/departments/911/webpage/heatwaves.htm) . Further, when forecasting a heat wave, forecaster looks for unusually high pressure in the upper levels of the atmosphere that continues for several days. http://www.weather.com/encyclopedia/heat/forecast.html
The NOAA Heat/Health Watch Warning System is in charge of the forecasting and warning of heat waves and possible risks of excessive heat. It measures the air masses over a region in order to warn the nation in advance of possible events of excessive heat. The development of this system was influenced by a similar system that existed in Philadelphia.
In Texas
In terms of what is considered a heat wave, it really depends on the region under consideration. Texas is engulfed with the hot and humid conditions of the heat waves from the Gulf of Mexico. This region’s records, with Texas in particular, have been set for the highest temperatures reached during a heat wave.
One of the most extreme cases recorded in this region was in the summer of 1980 when, overall, the disaster caused 1700 deaths. In Fort Worth, Texas, the heat wave lasted 69 days between June 23 and September 6 with the temperature exceeding 100 degrees and the highest temperature being 117 degrees Fahrenheit. http://en.wikipedia.org/wiki/1980_United_States_heat_wave
What is the impact of heat waves?
There are immediate as well as lasting effects of heat waves. When a heat wave strikes, the main concern is toward the health of the people of the region being affected. When the temperature exceeds the level the body can handle and cannot compensate for the lost fluid, heat-related illnesses develop. Depending greatly on the heat index, the illnesses can range from sunburn to a heat stroke and even death . However, this devastation is short lived because once the heat moves away from the region, there is no longer the risk of having heat illnesses. However, the same cannot be said for the agricultural and economic aspect of society because not only is it difficult for humans to endure the extreme heat, but the same goes for animals and crops (http://www.sdr.gov/185820_Heatwave_FINAL.pdf ) as well as electricity and water. For instance, during the 1980 heat wave, the cost in agricultural damage neared 44 billion dollars. The high heat is not longer a condition that crops can tolerate, especially with the extreme levels of evaporation. The loss of so much production most often leads to the rising of prices for these products. http://www.msnbc.msn.com/id/14153714/


These diagrams show the extreme temperatures that have passed through the Texas region.
http://www.ncdc.noaa.gov/img/climate/research/2000/sum/consect100sum00_pg.gif
http://texasscribbler.com/blog/images/060714_record_temps_02.jpg

This table shows the effects of different heat index levels on the severity of heat disorders.
References
http://www.weather.com/ready/heat/
http://www.co.pasquotank.nc.us/departments/911/webpage/heatwaves.htm
http://www.weather.com/encyclopedia/heat/forecast.html
http://en.wikipedia.org/wiki/1980_United_States_heat_wave
http://www.ncdc.noaa.gov/img/climate/research/2000/sum/consect100sum00_pg.gif
http://texasscribbler.com/blog/images/060714_record_temps_02.jpg
http://www.noaanews.noaa.gov/stories2005/s2366.htm
http://earthobservatory.nasa.gov/Newsroom/NewImages/images.php3?img_id=17366
http://www.nws.noaa.gov/om/heat/index.shtml
Droughts
by yuenkam2
Overview
The conditions that constitute a drought vary from area to area. Some factors that are considered are soil moisture, rainfall, aridity and levels in reservoirs. When the evaporation in an area is greater than the amount of rainfall that is considered “normal” is when a drought may start to occur. The prediction of droughts has many variables. Some information one would need is weather data for specific areas over extensive periods or time, crop yield data, water level data, etc. Predicting future droughts benefit an area because it helps mitigate how it will distribute, use, and conserve necessary freshwater sources to ensure the survival of an area and its production.1
Droughts in Texas are monitored by the Texas Water Development Board. They cooperate with other water boards in Texas such as the Texas Water Development Board and the Drought Preparedness Council's Drought Monitoring that is part of the Governor’s Division of Emergency Management.

"Drought" is defined by the U.S. Drought Monitor as “a moisture deficit bad enough to have social, environmental or economic effects”. The Department of Agriculture works in cooperation with the National Weather Service’s and the National Drought Mitigation Center (located at University of Nebraska) to produce the Drought Monitor every week in the United State. The Drought Monitor contains information such as forecasting future droughts, show where droughts are up-and-coming, and where droughts are persistent all over the country.
There are 5 levels of drought intensities2:
D0- Abnormally Dry: area may be entering drought/exiting drought phase, dryness slowing agriculture developement
D1- Moderate:lowest level of drought has set it, water supply is beginning to be affected along with crop damage, voluntary water restrictions may be primed
D2- Severe: losses to crops and feeding grounds very likely, water restrictions are now obligatory
D3- Extreme: water scarcity occurs even with water-usage restrictions in place, major agriculture loss
D4- Exceptional- extremely high levels of loss to agriculture and water shortages; water shortages creating an emergency situation where assistance is needed
One can also define areas of drought by what is physically affected the most by two categories:
A= agricultural effects to grazing grounds and crops
H= shortage of water supply in groundwater, resevoirs, and other freshwater sources
Currently, the normally dry area of the Texas Panhandle has gotten 1.0 in. of rain in the past week; which is more than the average precipitation in this area at this time. The rain has caused a 60-day of surplus rainwater there. Southern Texas that borders Mexico, on the other hand, has conditions categorized in the D3-D4 (from scale above). In Dallas, TX, they currently do not have any drought conditions.

If you look at where Dallas is located at the image above and where Dallas is located you can see that Dallas is in a category D0. If you look at the charts below, you will notice the reason why Dallas-Ft. Worth area is not in a drought stage is the adequate amount of precipitation. Also, the temperatures have not been exceedingly higher than normal so the land has not been drying out, nor the resevoirs depleted. Northeast part of Texas is actually the only part that isn't expierencing some level of drought.
2 http://drought.unl.edu/dm/classify.htm
..:: Dallas, TX::..

Flag of Dallas, Texas. Photo provided by http://en.wikipedia.org/wiki/Image:Flag_of_Dallas%2C_Texas.png]
*****Hope all  of you learned a lot about our lovely town of Dallas.. come again soon!*****


Comments (0)
You don't have permission to comment on this page.